데이터프레임
-
데이터프레임 = R언어에서 가장 중요한 자료구조
- 리스트 + 행렬
-
one observation per row
-
‘[ ]’ 기호나 ‘$’ 기호를 사용해서 접근한다.
data1$ID = datat1[, 1]
예시 데이터 : chicago
- 공기오염과 온도에 대한 데이터셋
- RDS 형식의 파일로 되어있다.
r
chicago = readRDS(""경로"")

# 경로 지정 예시
setwd(""경로"")
chicago = readRDS("")
데이터프레임 다루기 - 1
- dplyr 패키지 없이 자체적인 실력을 기르는 것을 목표로 한다.
- 익숙해질 때까지 반복!
1. 훓어보기
데이터를 훓어보자.
해답
r
# dim()과 str()
dim(chicago) # dim = dimension
str(chicago) # str = structure

# head()와 tail()
head(chicago, 3) # 앞에만 보기
tail(chicago, 5) # 뒤에만 보기
2. 변수 고르기
chicago 데이터로 다음 두 결과를 만들어보자.
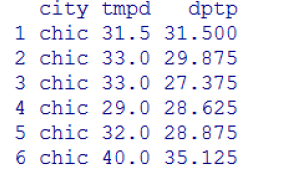
해답
r
# 우선 순서대로 변수 이름을 본다.
names(chicago)

# city ~ dptp가 몇 번째인지 본 뒤,
# subset()과 select()를 응용해 뽑는다.
head(subset(chicago, select = c(1:3)), 6)
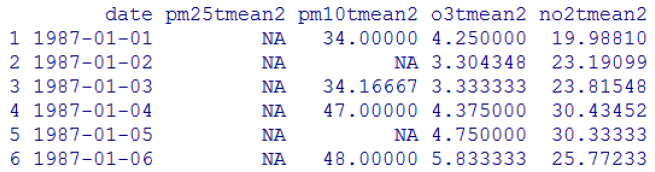
해답
r
names(chicago)
# 1st answer
head(subset(chicago, select = -c(1:3)), 6)
# 2nd answer
head(chicago[, -c(1:3)], 6)
3. 필터링 & 순서 맞추기
1번) 2로 끝나는 변수들만 보기.
해답
r
str(chicago[, grep("2$", names(chicago))])
2번) d로 시작하는 변수들만 보기
해답
r
str(chicago[, grep("^d", names(chicago))])
3번) 숫자가 포함된 변수들 보기 (자체)
해답
r
str(chicago[, grep("[1-9]", names(chicago))])
4번) 대문자가 포함된 변수들 보기 (자체)
해답
r
str(chicago[, grep("[[:upper:]]", names(chicago))])
필터링: 조건에 맞는 변수 고르기
문제1 : 변수 PM2.5가 30보다 큰 chicago의 row 뽑고, summary 내기
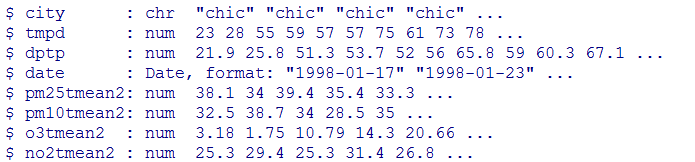

해답
r
# 조건에 넣을 이름 찾기
names(chicago)

# 조건을 건다. 조건 자체는 열 데이터.
chic.f = chicago[(chicago$pm25 < 100 & !is.na(chicago$pm25)),]

# 조건을 2개 걸기 = 괄호를 치고 변수 사이에 & 기호를 넣는다.
summary(chic.f$pm25tmean2)
문제2 : 변수 PM2.5가 30보다 크고, 변수 tmpd가 80보다 큰 chicago의 row 뽑기
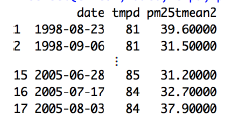
해답
r
# 조건에 넣을 이름 찾기
names(chicago)

# 조건을 2개 걸기 = 괄호 2개 사이에 & 기호를 넣는다.
# 열 데이터이므로 역시 콤마를 조건 뒤에 반드시 넣어야 한다.
chicago[(chicago$pm25tmean2 > 30) & (chicago$tmpd > 80),]
순서 맞추기 : 오름차순/내림차순
문제 : 날짜 순서에 따라 데이터 맞추기. 힌트: order()
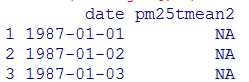
해답
r
# 날짜 데이터의 순서 맞추기 : order() 함수 사용
chic.o3 = chicago[order(chicago$date, decresing=T)]
head(chic.o3[, c("date", "pm25tmean2")])
데이터프레임 다루기 - 2
- dplyr 패키지 없이 자체적인 실력을 기르는 것을 목표로 한다.
- 익숙해질 때까지 반복!
4. 이름 바꾸기
변수 dptp와 pm25tmean2의 이름을 각각 dewpoint와 pm25로 바꾸기

해답
r
# names() 함수를 이용
names(chicago)
names(chicago)[c(3, 5)] = c("dewpoint", "pm25")

# 바꼈는지 재확인
names(chicago)
5. 새 열 만들기
새로운 열 detrend 만들기
- pm25detrend is made by subtracting pm25 from mean of pm25.
- pm10detrend is made by subtracting pm10 from mean of pm10.
- o3detrend is made by subtracting o3 from mean of o3.
해답
r
# with() 함수를 이용한다.
# with(데이터프레임, 계산/변화 내용)
chicago$pm25detrend = with(chicago, pm25 -
mean(pm25, na.rm=T))

chicago$pm10detrend = with(chicago, pm10tmean2 -
mean(pm10tmean2, na.rm=T))

chicago$o3detrend = with(chicago, o3tmean2 -
mean(o3tmean2, na.rm=T))
6. 그룹으로 묶기
1번. You might want to know what the average annual level of PM2.5 is.
So the stratum is the year, and that is something we can derive from the date.
1-1번 해답 : year 만들기
r
# year 변수 만들기
chicago$year = as.POSIXlt(chicago$date)$year + 1900
1-2번 해답 : average annual level of PM2.5, o3tmean2, no2tmean2
r
# with(), cbind(), tapply()를 같이 쓴다.
with(chicago, cbind(
    tapply(pm25, year, mean, na.rm=TRUE),
    tapply(o3tmean2, year, mean, na.rm=TRUE),
    tapply(no2tmean2, year, mean, na.rm=TRUE))
    )
- with()는 데이터프레임을 가져오는 역할
- cbind()는 각각의 열을 묶어준다.
- tapply()는 열 전체를 한번에 계산해준다.
2번. We might want to know what are the average levels of ozone (o3) and nitrogen dioxide (no2) within quintiles of pm25.
2번 해답
r
qq = quantile(chicago$pm25, seq(0, 1, 0.2), na.rm=TRUE)
chicago$pm25.quint = with(chicago, cut(pm25, qq))
with(chicago,
     cbind(
        tapply(o3tmean2, pm25.quint, mean, na.rm=TRUE),
        tapply(no2tmean2, pm25.quint, mean, na.rm=TRUE)
        )
    )
데이터프레임 다루기 Tip !
- 머리 속으로, 또는 노트에 적어가며 계속 그려보기
- 이게 행에 관한 내용인지 열에 관한 내용인지 판단하는 것이 중요하다.
- 행에 관한 내용이면 콤마(,) 앞에 넣어야 한다.
- 열에 관한 내용이면 콤마(,) 뒤에 넣어야 한다.