1번 문제
- MNIST 데이터셋으로 테스트 세트에서 97% 정확도 달성해보기
- KNeighborsClassifier() 로 만드는 것을 추천
- weights와 n_neighbor 하이퍼파라미터로 그리드 탐색 시도.
(타 블로그와 영어 자료를 참고…)
내가 해본 과정
- 데이터 불러오기
- 테스트 데이터 제작
- KNeighborsClassifier() 불러오기 → 분류기 제작
- 성능 측정
1. 데이터 불러오기
python
import numpy as np
from sklearn.datasets import fetch_openml
mnist = fetch_openml('mnist_784', version=1)

X, y = mnist["data"], mnist["target"]
2. 테스트 데이터 제작
python
X = X.to_numpy()
javascript
y = y.to_numpy() # y도 df이므로 np로 바꿈.
y = y.astype(np.uint8)
python
X_train, X_test = X[:60000], X[60000:]
y_train, y_test = y[:60000], y[60000:]

X_train = X_train[np.random.permutation(60000)]
y_train = y_train[np.random.permutation(60000)]
3. KNeighborsClassifier() 불러오기 → 분류기 제작
python
from sklearn.neighbors import KNeighborsClassifier
knn_clf = KNeighborsClassifier(n_neighbors=2,
                    weights='distance', n_jobs=1)
knn_clf.fit(X_train, y_train)
4. 분류기로 최적의 n_neighbor과 types 찾아보기
python
types = ['distance', 'uniform']

for k in range(1, 10):
    for j in types:
        knn_clf = KNeighborsClassifier(n_neighbors=k, weights=j, n_jobs=-1)
        knn_clf.fit(X_train, y_train)
        x = knn_clf.score(X_train, y_train)
        print("k : {0}, 가중치: {1}, 정확도: {2} " % (k, j, float(x)))
결과
아예 값이 이상하게 나오는 경우가 많았다. 이 방법은 비추.
답안
- gridsearch()를 사용해서 하는 경우가 더 많았다.
- 적절한 하이퍼파라미터를 찾을 때: GridSearch() 이용!
python
from sklearn.model_selection import GridSearchCV

param_grid = [{'weights': ["uniform", "distance"], 'n_neighbors': [3, 4, 5]}]

knn_clf = KNeighborsClassifier()
grid_search = GridSearchCV(knn_clf, param_grid, cv=5, verbose=3)
grid_search.fit(X_train, y_train)
python
grid_search.best_params_
python
grid_search.best_score_
python
from sklearn.metrics import accuracy_score

y_pred = grid_search.predict(X_test)
accuracy_score(y_test, y_pred)
2번 문제
- Mnist 이미지를 어느 방향으로든 한 픽셀 이동시킬 수 있는 함수 만들어 보기
scipy.ndimage.interpolation 모듈의 shift() 사용 가능. - 이후 다음 훈련 세트에 있는 각 이미지에 대해 네개의 이동된 복사본(방향마다 한 개씩)
을 만들어 훈련 세트에 추가 - 마지막으로 확장된 데이터셋에서 앞에서 찾은 최선의 모델을 훈련시키고 테스트 세트에서 정확도 측정
- 모델 성능이 더 높아졌는지 측정하기
1번
python
from scipy.ndimage.interpolation import shift

def move(image, dx, dy):
    image = image.reshape((28, 28))
    shifted_image = shift(image, [dx, dy], cval=0)
    return shifted_image.reshape([-1])
- 받는 이미지가 숫자이므로 행렬로 바꿔야 그림이 된다. 따라서
.reshape()를 넣는다. - return 할때는
.reshape(-1)을 넣어서 원래대로 돌려줌.
python
image = X_train[1000]
move_to_down = move(image, 0, 5)
move_to_left = move(image, -5, 0)
python
import matplotlib.pyplot as plt

plt.figure(figsize=(12,3))
plt.subplot(131)
plt.title("Original", fontsize=14)
plt.imshow(image.reshape(28, 28), interpolation="nearest", cmap="Greys")

plt.subplot(132)
plt.title("Shifted down", fontsize=14)
plt.imshow(move_to_down.reshape(28, 28), interpolation="nearest", cmap="Greys")

plt.subplot(133)
plt.title("Shifted left", fontsize=14)
plt.imshow(move_to_left.reshape(28, 28), interpolation="nearest", cmap="Greys")

plt.show()
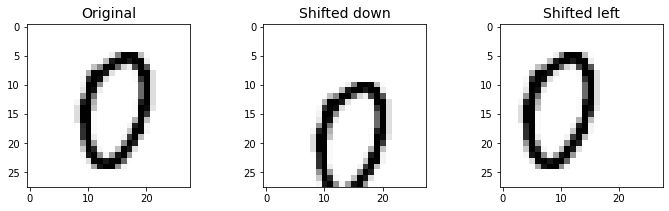
1000번대 이미지는 다음과 같다.
2번
python
X_train_augmented = [image for image in X_train]
y_train_augmented = [label for label in y_train]
python
dir = ((1, 0), (-1, 0), (0, 1), (0, -1))
for d in dir:
    for image, label in zip(X_train_augmented, y_train_augmented):
        X_train_augmented.append(move(image, d[0], d[1]))
        y_train_augmented.append(label)

X_train_augmented = np.array(X_train_augmented)
y_train_augmented = np.array(y_train_augmented)
- dir 지정 시 반드시 set()을 사용할 것! 그냥 리스트로 하면 RAM 부족으로 컴퓨터 뻗는다…!
- 자료구조가 중요한 이유…
3번
python
# 만든 자료 한번 array로 다시 바꿔주고
X_train_augmented = np.array(X_train_augmented)
y_train_augmented = np.array(y_train_augmented)

# 섞어주기
shuffle_idx = np.random.permutation(len(X_train_augmented))
X_train_augmented = X_train_augmented[shuffle_idx]
y_train_augmented = y_train_augmented[shuffle_idx]
python
from sklearn.neighbors import KNeighborsClassifier
knn_clf = KNeighborsClassifier(**grid_search.best_params_)
** 가 의미하는 것 : 클릭
python
knn_clf.fit(X_train_augmented, y_train_augmented)
4번
python
y_pred = knn_clf.predict(X_test)
accuracy_score(y_test, y_pred)
★ 3번 문제 ★
- 캐글 타이타닉 데이터셋 도전하기
- 문제 > “어떠한 유형의 사람들이 타이타닉호에서 더 많이 살아남을 것 같은가? 에 대한 예측 모델을 만드시오.
- 설정과 데이터 다운로드
- EDA : 탐색적 데이터분석
- 모델을 훈련, 조정, 통합(ensemble)하기
- 예측을 캐글에 올리고 점수 받기
설정 & 데이터 다운로드
python
import numpy as np
import pandas as pd

import matplotlib.pyplot as plt
import matplotlib as mpt
python
train_data = pd.read_csv("datasets_titanic/train.csv")
test_data = pd.read_csv("datasets_titanic/test.csv")
EDA
어떤 변수가 있는지 보기
python
train_data.columns.values
꼬리와 머리 보기
python
train_data.head()
python
train_data.tail()
변수 보기
python
train_data.info()
python
test_data.info()
모델
모델 고르기
- 기본적으로 분류 모델
- 분류 모델에는 다음과 같은 것들이 존재한다.
4번 문제
- 스팸 분류기 만들어보기